Tuesday, February 24, 2009

New Lows, and Psychology With the Major Indices

Well, I haven't had to do one of these posts in a while. On Monday, the U.S. stock market plunged to fresh lows for this bear market, to the point that all three leading U.S. indices finished the day at their lowest marks since 1997. This now means that we have moved lower than the lowest that the market ever got during the entire bursting of the dot-com bubble, and the aftermath, including a mini-recession, following the terrorist attacks in September 2001. At this point, the S&P 500 index of the 500 largest stocks in the market has now dropped 52.5% from its highs in October 2007 on a closing bases, once again confirming this to be the worst bear market since the Great Depression, and if we manage to sink just another two percent or so on the S&P, that will make this officially the worst slide in the broad index since the bear that began with Black Monday and the crash of 1929.

With the market's latest slide to fresh 12-year lows, it begs the question once again: how much longer can this bear market realistically last, and how much further can it drop?

Let's go in reverse order, starting with the magnitude question. Remember the chart I have posted here on a few occasions over the past several months:

S&P Composite Price Index Bull and Bear Markets 1914-2008


Market TopIndex High% IncreaseMarket BottomIndex Bottom% Decrease
10/9/2007 1565.15 101.5% 12/203/2009 743.33 -52.5%
03/24/2000 1527.46 59.6% 10/9/2002 776.76 -49.2%
07/17/1998 1190.58 304.3% 10/08/1998 957.28 -19.6%
07/16/1990 369.78 67.1% 10/17/1990 294.51 -20.4%
08/25/1987 337.89 233.1% 12/04/1987 221.24 -34.5%
11/28/1980 140.52 61.7% 08/12/1982 101.44 -27.8%
09/21/1976 107.83 73.1% 03/06/1978 86.90 -19.4%
01/05/1973 119.87 73.0% 10/03/1974 62.28 -48.0%
11/29/1968 108.37 48.0% 05/26/1970 69.29 -36.1%
02/09/1966 94.06 79.8% 10/07/1966 73.20 -22.2%
12/12/1961 72.64 86.4% 06/26/1962 52.32 -28.0%
08/02/1956 49.75 267.2% 10/22/1957 38.98 -21.6%
05/29/1946 19.25 157.7% 06/13/1949 13.55 -29.6%
11/09/1938 13.79 62.2% 04/28/1942 7.47 -45.8%
03/10/1937 18.68 131.8% 03/31/1938 8.50 -54.5%
07/18/1933 12.20 120.6% 03/14/1935 8.06 -33.9%
09/07/1932 9.31 111.1% 02/27/1933 5.53 -40.6%
09/07/1929 31.86 408.9% 07/08/1932 4.41 -86.2%
07/16/1919 9.64 60.7% 08/24/1921 6.26 -35.1%
11/20/1916 10.55 59.1% 12/19/1917 6.00 -43.1%


Having updated the top line of this chart for this week's unsavory market action, you can see how this has now clearly eclipsed anything we've seen since the late 1930s in terms of the drop from peak to trough in the S&P 500 index. Unfortunately, this leaves us in a bit of uncharted waters as far as predicting how much more weakness there could be from here. In 1937-38, after a 131% runup from the 1935 lows, the broad market tumbled 54.5%, just a shade above what we have experienced so far on Wall Street. And of course, there was the original crash that is commonly thought to have begun the Great Depression, where stocks ran up a sick 408% from 1921 through 1929, only to plunge by an inconceivable 86.2% over the following three years.

For starters, let's just think the unthinkable for a minute here. What if the S&P or the Dow dropped 86.2% again from the highs, top-to-bottom, this time around? That would leave the S&P 500 index at 215.99. And the Dow, which peaked at just over 14,000 in October 2007, would be left at right around 1,940. Those numbers are so ugly to think of, that I'm simply not going to. The Great Depression occurred after a confluence of a number of events, much of which involved our government more or less turning a blind eye to the nation's troubles and simultaneously increasing protectionism at a time when our economy was far too fragile to handle such moves. Although a deaf, dumb and blind man could easily call into question the quality of the governmental response to the crisis this time around, the fact remains that we are far from turning a blind eye to the issues. And with globalization already a reality, a significant increase in protectionism like we saw in the 20s and 30s is unlikely to occur at this point or perhaps ever again for this country. So I believe that a drop of 86% like we saw in the Great Depression is not called for given what we know so far about the current situation. Things are terrible for sure, but we've already dropped 52.5% at this point, so the badness has been factored in to a historically very significant degree already.

Looking at the chart, as I have pointed out before, the best predictor we have of the magnitude of the drop from the highs seems to be the magnitude of the runup leading up to that market top. As I wrote about last year, leading up to this 86.2% drop in the S&P from 1929-1932, we had an unprecedented 408.9% surge from the lows of the previous cycle in 1921. Leading up to the 54.5% decline in the S&P from 1937-38 was a 131.8% spike from March 1935 to March 1937. From August 1982 through August 1987, the S&P 500 jumped over 233%, but two months later was the single worst day in the history of the market in percentage terms as the S&P lost around 20% of its value in just one day. Although this pattern is far from perfect throughout the years, generally speaking it is fair to say that the smaller trough-to-peak runups have led to smaller peak-to-trough selloffs following those runups.

Using these figures as a guide, the run from the October 2002 bottom for the S&P to the October 2007 top was 101.5%. This is a big spike in historical terms, but in looking at the chart it only represents the 10th-largest trough-to-peak gain for the S&P in the past 100 years. This seems to suggest that, with stocks now showing the third-worst bear market drop in history, it is unlikely that we see a huge further drop from current levels. Now of course a whole lot more goes into this equation than just how low the S&P had gotten in 2002 and how high in 2007, but as I said above there is not a lot of evidence to suggest that we are going to see a drop of anything even remotely close to the magnitude of the Great Depression here. At this point I would be a bit surprised to see us make fresh 12-year lows on the major indices for exactly one day and then not drop any further, but I am thinking maybe another 5-10% or so from here would fit in very nicely on the chart above as the bear market lows for this cycle. Let's all hope I am right about that.

Now, let's move on to the question of the likely length of this bear market, which I find to be the more interesting of the two aspects to consider. I've had this theory for a long time, and yet it's not something I have really ever heard or read anywhere else that I can recall. It's a theory relating to the technical aspects of investing, and the psychological underpinnings of major indices like the Dow Jones Industrials Average which are known, followed and focused on by millions of investors not just in the United States but all around the world. Using this theory led me to make a seemingly incongruous prediction around the turn of the millennium ten years ago, but the more crap we go through with this market and with the DJIA, the more I find myself turning back to this theory and thinking there might really be something to it.

The theory I am talking about posits that the DJIA, easily the single most followed and known major market index on the planet, has major problems whenever it first reaches and surpassed major psychological milestone levels. Now, with the Dow only being around for about 110 years, and with there not being many major psychological levels to pass during that time, there are admittedly not a lot of data points to work from with the Dow, but take a look at this, a chart showing the history of the Dow Jones Industrials Average since 1900:


As you can see, the DJIA crossed the 100 mark for the first time in late 1916. I view this as the first of the psychologically important breakthroughs for the world's most widely-followed index, the first move into triple digits. Although the market was in a sustained uptrend at that time, you will note that the index bounced right off of the triple digit mark as soon as it touched there in 1916, and it took another three years or so to get back to retest that 100 level. The thing I tend to focus on, though, is not how long it took the market to plow consistently through this important psychological point, but rather how long it was until 100 was passed on the upside for the last time, not the next time. So, in other words, the Dow first hit 100 in 1916. I want to know how long did it take before the Dow moved back above the key 100 for the last time, i.e., for good? And the answer? In late 1942, with World War II looming, the Dow bottomed at 92 and change, before rallying furiously to over 200 by shortly after the end of the war and the beginning of what we today refer to as the Baby Boom. So that is 26 years from the first time the Dow touched 100, to the very last time it touched 100 and left that level in the dust, never to be thought of again. In my view it took 26 years for the Dow to officially "break through" the key triple-digit level from the very beginning to the very end. 26 years. That is an entire generation of investors dealing with the reality of the 100 level on the Dow.

Now let's move on to the next key psychological barrier -- quadruple digits. The Dow first touched 1000 on an intraday basis in early 1966. In fact, the DJIA four times crossed the 1000 mark in the mid 60s, on all four occasions failing to climb above 1001 before falling and closing below the key 4-digit mark. In fact, take a look at that chart up there at the period starting in 1966 when the major index first touched 100, and you will see at least five separate tops where the market rallied back to right around the 4-digit mark before failing and dropping back below as investors struggled to get their minds comfortable with the DJIA being at a 4-digit number. From the chart I would even go so far as to say that this stands out as the most prolonged period of plateau in the Dow in the entire history of the index. After a big drop during the 1981-82 recession, the Dow finally crossed the 1000 level on the upside for the last time in late 1982. So how long was it from the first touch of this key level on the Dow -- early 1966 -- to the time that the Dow flew past 1000 for the last time, finally disposing of the psychological barrier that is a four-digit Dow? 16 years.

So, it took 26 years for the investing public to get psychologically comfortable with the DJIA in three digits, and it took another 16 years to get comfortable with four digits. So what's the next big psychological milestone for the Dow? Yep -- 10,000.

The Dow first crossed the 10,000 mark on March 12, 1999, in what turned out to be the absolute height of the dot-com bubble. I remember it like it was yesterday. Me and a bunch of fellow clowns decided to skip our classes in law school that day and just sit home, get hammered and watch as the Dow first crossed this key level, at the time thought to be indicative of just how far the U.S. had come, and how we had enabled technology to lift us to new heights, financially speaking. As we saw with the first touch of 100 and of 1000, there was some immediate pullback from that point, but unlike what we saw with 100 and 1000, the market took it pretty well in stride right away this time, consistently closing above 10,000 within a month or so of first touch. Soon after, however, the market topped as the internet bubble burst in a big way, and the market spent the better part of 2000-2001 dillydallying right above 10k before finally dropping below it in the wake of the 2001 terror attacks which closed Wall Street down for a week. The Dow then proceeded to drop as low as 7286 during the recession of 2001-2002, before resuming a huge rally that carried the world's most widely-followed index to a stunning high of just over 14,000 in October 2007, actually making me rethink my psychological barrier theory as the index threatened to leave 10,000 in the dust after just a few short years.

But never fear, psychology always seems to win out in the end, and here we are with the Dow languishing once again in the low 7000s, nowhere near 10k and certainly not having left 10k in the dust as I had been hoping just a couple of years ago. Now to be sure, I'm not at all trying to say that the only reason the market is down now is psychology related to the Dow 10,000 level. That would be preposterous and would deny the very real financial and economic problems impacting our country right now. But that's the same story with the Dow's stallout at the 100 level -- the Great Depression hit, the worst unemployment and economic times in our country's history -- and again with the problems the Dow had with the 1000 level, which saw the oil crisis and the stagflation of the 1970s. But, I can't help but notice it nonetheless. I mean, can you deny the parallels?

So how much longer could this bear market last? Well, it took the Dow 26 years from the first time it crossed 100 to the last time. It took 16 years from the first time it crossed 1000 to the last time. And now we crossed 10,000 for the first time in early 1999. Let's just take an average of the first two psychological barriers -- 21 years. That would mean it would be 2020 before the Dow is finally finished with 10,000 for the last and final time. This doesn't mean that the market couldn't have several powerful rallies and make investors billions of dollars between now and then. It just means that, if the theory holds true, we could be dealing with Dow 10,000 plus or minus, say, 30%, for still another decade-plus, and it would not be out of the norm from a historical perspective.

And while Dow 10k in 2020 probably sounds vomitous to many of you out there (and it should), you have to note that at least that would mark a 40% up move from here.

Labels: , , ,

Wednesday, December 03, 2008

Deepening Recession

As you can probably tell if you've been reading here with any regularity over the past several months, I am hugely into the economy, the stock market and all things business. I've been reading up quite a bit just lately on the pace of retail and enterprise sales over the past few weeks, trying to get a handle on what is happening with the U.S. economy right now, as opposed to in the third quarter, a couple of months ago or even a couple of weeks ago. This is how I expect to be able to profit in the stock market even during this time of obvious economic suckitude -- by staying ahead of the market and making some moves to predict what is likely to happen in the coming days and weeks on Wall Street.

So, we all know how bad September was for the economy. Lehman Brothers fell, Merrill Lynch was forced to sell itself, AIG collapsed. The joke of a TARP plan was put forth and eventually passed, and the shock to the whole economic system in September was tremendous, clearly triggering a negative GDP reading for the first month in more than six years as a result, and sending the major U.S. averages down close to 10% for the month.

And then came October. Instead of bouncing back, the economy took a big turn for the worse, even from September's crappy numbers, as the bottom fell out of the stock market, with nearly every single leading U.S. index posting its worth month in history. This had two devastating effects from an economic perspective. First, individual consumers -- you and me -- saw their net worth, their life savings, their retirement accounts, you name it, all plunge to ridiculous levels, and this caused the consumer as a whole to really pull in their belts when it came to spending on things like clothes, electronics, vacations, holiday gifts -- all the stuff we're usually out there buying up in droves around this time of year. But secondly, and in many ways even more crushing to various sectors of the U.S. economy, businesses took a look at their stock prices, their falling revenues, and they all started reining things in as well. Big time. Sure, the Amazon.com's and the eBay's and the Home Depot's and the Gap's of the world suffered in October as the consumer stopped spending, but the effect of the slowdown in corporate spending was devastating as well to companies like Microsoft, Intel, Dell, ADP -- enterprises whose primary customers are businesses, not individuals. For much of the technology space at large, the complete and utter freezing of IT spending by companies in the U.S. and around the world turned October into the worst month from an economic perspective in most people's entire lifetimes.

Since October ended, the big question at least in my mind has been how will November's economic numbers shape up? After the shock of September and the huge dropoff in October, can it get any worse? And sadly, from what I've been reading, I believe the answer is going to be a resounding Yes.

First, the consumer front. Although initial reports were that Black Friday retail revenues came in ahead of expectations, causing a bit of optimism as this past weekend began for the retail sector at large, the news seems to have only gone downhill from there. Word is that the rest of the post-Thanksgiving weekend saw far smaller crowds than expected, and that overall sales for the traditional beginning of the holiday shopping season are not shaping up well at all. Just on Tuesday, we saw analysts predicting dismal retail sales for the month of November overall, in many cases down well into double-digits from November 2007 levels, which take it from me is a pretty much unheard-of sized drop. Credit card giant Mastercard is confirming this trend in Wednesday's Wall Street Journal, with its credt sales tracking unit reporting that November sales appear to have sunk by 20% at apparel and department stores, 24% at luxury stores and 25% in electronics stores year-over-year. Again, for those of you who don't follow this stuff regularly, I have never seen numbers like this for a month in my entire lifetime, that is for sure. The overall point here is, November is shaping up to be yet another hideous month on the consumer side for the U.S. economy, which traditionally comprises about 2/3 of total U.S. GDP. Not good.

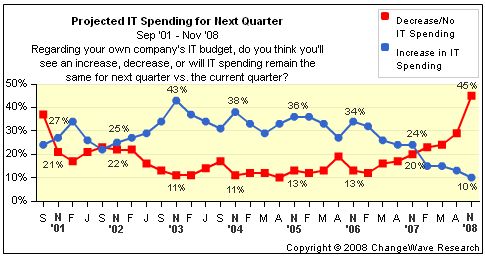
What about hopes for a pickup in November on the corporate spending side? This too looks like it's not gonna happen. Market research firm ChangeWave conducted a survey of IT spending professionals in nearly 2000 large U.S. companies in mid-November, and the results were staggeringly awful. First, they asked these IT professionals whether they expect IT spending to increase, decrease, or remain the same in Q1 of 2009 as compared to Q4 of 2008 that we are in now. Here were the results, with a graph showing the results of this question asked every quarter going back to 2001 when ChangeWave first began recording this survey:


Ooooof. That's worse than yet another 4-outer after the flop I took last night in the blonkament I played. What's more, you can see from the historical numbers that November is typically a very optimistic time of the year, when expectations for corporate spending are generally increasing if you look back for the past several years in the November timeframe. This year, 45% of respondents indicated that Q1 spend budgets are likely to decrease from Q4's budgets, which does not portend well at all for IT vendors in the U.S. even as we head into 2009.

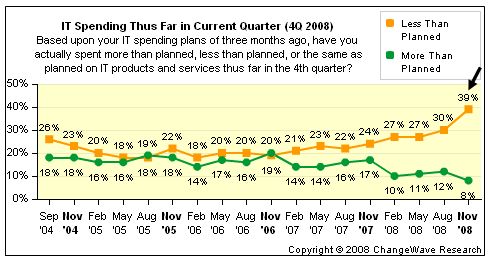
The other disturbing result from the November ChangeWave survey came when they asked how the pace of the current Q4 IT actual spend was going as compared to the amount they had budgeted to be spent during Q4. In other words, we already saw above that companies are looking to rein in spending starting in 2009, but now let's see how much of their budgeted amounts they are even spending here in Q4 of 2008. The results -- equally dismal:


Nearly 40% of respondents indicate that they are already spending less than planned on corporate IT purchases in the October - December quarter, also a dramatically historic high for this survey.

What does all this mean? In a nutshell, I am looking at numbers which indicate that sales on both the consumer and the enterprise side in November are going to come in looking just plain awful. After a very weak September and a devastating October on both fronts, November is not shaping up at all to provide any kind of relief like one might have hoped for for the largest companies in this country. And to me this can only spell one thing, which is continued weakness in stocks for at least the balance of this month until investors can turn their attention to the December news and try to make sense of whether or not a bottom has finally been put in to this dramatic and horrible economic downturn now going on four months in the U.S. economy.

Until then, you can look for me to be shorting enterprise-focused technology stocks, based on the graphs I posted above. There is definitely some money to be made there, if you know how to play it.

Labels: , , ,

Friday, November 21, 2008

Bear Markets and Recessions Take II

OK so remember that chart I put up a while back showing the magnitude of historical bear markets since 1914? Well here it is again, in case you missed it:

S&P Composite Price Index Bull and Bear Markets 1914-2008


Market TopIndex High% IncreaseMarket BottomIndex Bottom% Decrease
10/9/2007 1565.15 101.5% 11/20/2008 752.44 -51.9%
03/24/2000 1527.46 59.6% 10/9/2002 776.76 -49.2%
07/17/1998 1190.58 304.3% 10/08/1998 957.28 -19.6%
07/16/1990 369.78 67.1% 10/17/1990 294.51 -20.4%
08/25/1987 337.89 233.1% 12/04/1987 221.24 -34.5%
11/28/1980 140.52 61.7% 08/12/1982 101.44 -27.8%
09/21/1976 107.83 73.1% 03/06/1978 86.90 -19.4%
01/05/1973 119.87 73.0% 10/03/1974 62.28 -48.0%
11/29/1968 108.37 48.0% 05/26/1970 69.29 -36.1%
02/09/1966 94.06 79.8% 10/07/1966 73.20 -22.2%
12/12/1961 72.64 86.4% 06/26/1962 52.32 -28.0%
08/02/1956 49.75 267.2% 10/22/1957 38.98 -21.6%
05/29/1946 19.25 157.7% 06/13/1949 13.55 -29.6%
11/09/1938 13.79 62.2% 04/28/1942 7.47 -45.8%
03/10/1937 18.68 131.8% 03/31/1938 8.50 -54.5%
07/18/1933 12.20 120.6% 03/14/1935 8.06 -33.9%
09/07/1932 9.31 111.1% 02/27/1933 5.53 -40.6%
09/07/1929 31.86 408.9% 07/08/1932 4.41 -86.2%
07/16/1919 9.64 60.7% 08/24/1921 6.26 -35.1%
11/20/1916 10.55 59.1% 12/19/1917 6.00 -43.1%

The big change on this chart is on the top line, where I have updated the magnitude of this current bear market with the most current numbers, including Thursday's 11-year closing low on the S&P 500. As you can see, this leaves us now down just a shade under 52% from the peak of the broader market index in the U.S., all within approximately 13 months of action on Wall Street.

Interestingly, note that this update now officially makes the bear market of 2008 the 3rd worst in magnitude in the the U.S. going back as far as we have reliable index data to measure. Back a month ago or so when I first posted this, we were looking at a top-10 bear market but not even in the top 5 of all time, but now we are squarely beyond the dot-com bubble bursting of earlier this decade as well as the blistering bear of the 1970s. In fact, this is now the worst bear market ever recorded in this country that did not occur during the Great Depression. That's something interesting for you right there isn't it? It certainly gives a solid perspective into #1 just how bad this market action has been this year,and #2 how oversold U.S. stocks really are right now at this point.

So today I wanted to analyze a question which is certainly on my mind and the minds of investors all across this country and the world these days: what is the historical relationship between the stock market and recessions? In other words, what does the market typically do during recessions, when does it peak, and when does it bottom?

Luckily, there is much data with which to study the answer to this exact question, and the answer, at least in light of the last several recessions, falls into a very discernible pattern. Let's start by taking a look at the following charts, which show the action in the broad S&P 500 index during the last six recessions prior to this one:


The vertical lines in the above charts show first the peak of the business cycle (the beginning of a recession) and then the lows of that cycle (the end of the recession). Interestingly, the broader market does not tend to peak right along with the peak in the business cycle, and then to trough right along with the bottom of the recession; rather, the market tends to anticipate both the onset of a recession (dropping before the recession begins), and then also the recovery (rising before the recession ends). Using the history of the last six U.S. recessions as a guide, you can see pretty easily from the above charts that the stock market generally starts to fall before a recession starts -- probably contributing in some small, ironically circular way to igniting the recession in the first place -- and then it tends to fall very sharply during the first stage of a recession, but then it starts to recover in the late stages of a recession before the recession has reached its bottom -- again, ironically, probably helping trigger the recovery to some degree. If you look at those charts above, you can see this pattern quite clearly in each of the last six recessions in the U.S. Stock prices fall dramatically as the economy enters a recession, which we certainly have seen once again this time around in 2008. Then, the market begins its recovery from its own bottom some short time before the economy has gotten out of a recession.

You can also see quite clearly from the above charts that, in five of the last six recessions in America, the stock market peaks a few months before the actual start of the recession and starts falling even before the recession officially begins. This is why the stock market is often said to be a leading indicator with respect to business cycles, or a good predictor of what is to come as far as economic activity in this country.

So in sum, recent history shows with surprising repetition in patterns that when an economic recession is coming, stocks in this country tend to fall dramatically before the recession and during the first half or so of the recession, followed by a relatively sharp recovery in the late stages of a recession and helping to lift the economy out of negative GDP land.

So what does all this mean with respect to the current stock market situation? Well let's look at where we're at right now. The economic recession of 2008 officially began in the third quarter of this year, as the Q3 GDP was the first quarterly GDP number to go negative (-0.3%, as reported earlier this month and in my view likely to be revised slightly lower when it is re-reported in December). Realistically, we will probably be viewed as officially turning negative in GDP sometime in August, and most definitely by September when Lehman Brothers fell and the entire financial world starting turning on its head. And let's look now at the 1-year chart of the S&P 500 index:


And there you can see the S&P 500 falling from around 1426 in May down to right around 1200 in August, just before the recession began. So, so far we're right on pattern with the noticeable drop in advance of the recession beginning in August, and now a sharp drop as the recession has begun in earnest for the past 4 or 5 months now. So the next thing we should be looking for is for the market to stop falling and eventually start recovering, somewhere around halfway through the recession as has happened in the recent past.

Most economists are predicting no economic recovery of any substance until sometime in mid-2009. I think that is a reasonable assumption. Just how strong that eventual recovery is still very much remains to be seen, and probably has a whole lot to do with what the government does to help stimulate things between the time when Barack Obama takes office in late January and next summer. But for the sake of argument, let's call this a full-year-long recession -- longer than the average, but perhaps a reasonable assumption given the massive credit bubble that has burst all over the country over the past year -- which would mean that the recession lasts from August 2008 through August 2009. If the market continues to fall until roughly halfway through the recession as has been the pattern over the six recessions immediately preceding this one, then we are looking at a market bottom sometime around January or February of 2009. In truth, the charts above show the market generally bottom either a little bit before or a little bit after the midpoint of the recession, but generally speaking, it makes sense that this market should bottom sometime around the beginning of the new year. This would coincide very nicely with Barack Obama's assumption of the presidency in late January of next year. It seems reasonable to me that the market will likely be putting in a bottom sometime between now and late January / early February, with hopefully the onset of a new beginning and the merciful end of the Bush administration sparking a nice optimism rally on Wall Street.

So if there's one glass-half-full thing to be said about the ludicrous stock market declines over the past year, it's that history shows us with somewhat shocking regularity that we are likely very close to the bottom of the current down cycle for U.S. stocks. This is true both in magnitude of the loss -- as we are now saddled with the third-largest decline in stock prices of all time in this country -- and the time until the gains resume, judging from recent history of recessions and bear markets in the U.S. Anyone with any cash who is looking to get in to the market at good, solid prices, ones which have 120 of the 500 "blue chip" stocks in the S&P 500 trading below $10 a share (the largest percentage in history, and more than double the amount of blue-chips below $10 in the last recession in 2002), should with all luck have a fairly easy time picking winners anywhere around current levels, which are not likely to continue to exist much beyond the new year if history is a good guide. I've said it before and I'll say it again -- you don't make money in the stock market by running away when everyone else is running away as well. It's kinda like poker in a way, where you generally profit from playing tight at a loose table, and loose at a tight table. With stocks, never forget the old adage: buy low, and sell high. If you can't see that this is one of those "low" times, then you are likely in need of the mostly costly eye exam you might ever fail to get.

Labels: , , ,

Friday, November 07, 2008

Recession-Era Unemployment

Well, just like that we are already higher in U.S. unemployment than the peak unemployment of the 2001-2002 recession. The Labor Department announced on Friday morning an absolutely dismal report of not only 240,000 jobs lost in October -- surely the single worst month for the U.S. economy in more than 25 years -- but also downward revisions to the number of jobs lost in August and September in the U.S. Combined with the revisions which added an additional 250,000 jobs lost during the prior two months, this brings the total jobs lost in the U.S. economy during just calendar year 2008 to a sickening 1.2 million. 1.2 million jobs fewer today than on December 31, 2007. Just think about what that means to the economy in this country (and think about how many more middle class jobs will have to be cut by big business if corporations have their taxes hiked). Anyone out there reading this, if you think your job is "safe", odds are siginficantly great that you are deluding yourself. Lord knows my job is at risk, as is the job of just about every one of the what, 12 million people sitting in their offices within a couple miles of me right now in New York City.

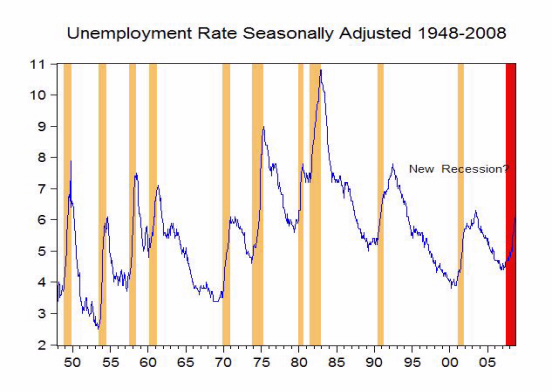
Looking back at recent history as a guide, the U.S. unemployment rate, which today spiked unexpectedly strongly to 6.5%, peaked at 6.4% in 2001, and now sits at its highest rate since March 1994. Anybody wondering how bad U.S. unemployment can typically get in good times, in "normal" recessions, and in the bad recessions? Well, I'm your guy. The internet is a wonderful thing.

Here's the chart of historical unemployment rates, by percent of the measured workforce, which are reported monthly by Labor, going back to 1948. The vertical strips on the graph show the economic recessions superimposed on top of the unemployment rate chart below:


Now, as you can see from the chart above, using economists' generally-accepted definition of a recession as two consecutive quarters of shrinking U.S. GDP, there have been ten recessions that have occured since 1948, not counting the one the U.S. is currently in, which will be the 11th. Following are the peak unemployment rates, expressed as percentages, for each of those ten recessions:

1948-49: Oct 1949 7.1%.
1953-54: May 1954 5.9%
1957-58: Jul 1958 7.5%
1960-61: May 1961 7.1%
1969-70: Mar 1971 6.0%
1973-75: May 1975 9.0%
1980-80: Jul 1980 7.8%
1981-82: Dec 1982 10.8%
1990-91: Jun 1992 7.8%
2001-01: Jun 2003 6.3%

So, at 6.5%, we are already ahead of the peak unemployment rate in the brief and shallow recession following 9-11 in late 2001, although interestingly that peak did not occur until summer of 2003, well after the end of that particular recession. We are also ahead of the peak in the 1969-70 recession as well as the 1953-54 trough, both also regarded as relatively shallow recessions from a historical perspective. The Great Depression, not on these lists because the monthly unemployment figures were not officially measured and recorded until after World War II, is widely known to have featured the worst unemployment rates in U.S. history and is clearly the deepest, most sickening recession we have seen, with unemployment widely believed to have peaked just above 25% during 1933. But even with all the financial crisis business going on, there is no reason in my mind to believe we come anywhere remotely close to that level today. But this leaves a lot of room between 6.5% and 25% to try to figure where we land on the unemployment scale.

Assuming this is one of the more severe, deep recessions the U.S. experiences, as is widely believed and which I personally believe to likely be the case as well, we can look to the deeper recessions on the above list as a guideline to the likely landing point for U.S. unemployment. The two longest and deepest recessions in the U.S. measured by U.S. Gross Domestic Product since 1948 occurred in 1973-75 and 1981-82. This should not be surprising, as unemployment rates during those periods peaked at the highest points in the last 60 years as well during those two troughs, at 9.0% in May of 1975 and a whopping 10.8% in November and December of 1982. Those are hideous figures for sure, ones which would mean an increase in total unemployed persons in the U.S. by another 50% or so from current levels.

At this point in time, I can't (or don't want to) think of things getting quite that bad in the recession of 2008-2009. But in even the "normal" recessions -- the things I have written about here that happen with stark regularity as a natural effect of the economic cycles of capitalism -- unemployment has tended to peak somewhere north of 7%. That seems highly likely here. In fact, as this economic trough is likely to be more severe than your average recession, it seems logical to expect a higher than average number of unemployed Americans this time around. Looking at all those figures above, I think a final peak unemployment number of somewhere between 9 and 10% probably seems like a rational, reasonable expectation. As I mentioned, however, that is going to be a major mess for incoming President Barack Obama, as there are already 3.84 million Americans on long-term unemployment with the unemployment rate sitting at 6.1%. Raising that number to 5-6 million people out of work over the long term can only lead to hideosity for the national economy in the short term.

Which is why a story like this is so encouraging. Despite the stated goal of the left in this country to increase redistribution of wealth from the alleged "upper" class to the middle- and lower class, we are at least starting to see some senior Democrats acknowledging what I've been saying for a long time and was in fact calling for here just yesterday. Stimulating the economy needs to be Issue #1, 2, 3, 4 and 5 in the minds of the leadership of this country right now, and doing that certainly should not include tax hikes, not even on the richie riches of the world. Permanent tax cuts, on the other hand, now that's what I'm talkin about. Not because I want or need to have more money in my own pocket, but rather only because kick starting the economy is crucial for all the people of this country. Maybe Nancy Pelosi actually isn't the biggest fool of all time after all?

Labels: , , ,